

A payment reconciliation dashboard can tell your finance team how many transactions matched, how many didn’t and where the exceptions are sitting. That’s useful, but is it enough? What do those exceptions actually mean for the business?
A $50 unmatched transaction and a $500,000 settlement discrepancy shouldn’t get the same attention. An exception that’s been open for two hours isn’t the same as one that’s sat unresolved for 45 days. A team that closes 95% of its exceptions can still have a serious problem if the remaining 5% hold most of the financial exposure.
This is where reconciliation has to move beyond reporting. A modern payment reconciliation dashboard should connect exception risk, financial exposure and resolution performance. That way your team can see what went wrong, how much it matters, who owns it, how long it’s been open and whether the process is getting better. That’s the job of a reconciliation control tower, and this guide shows how to build one.
What Is a Reconciliation Control Tower?
A reconciliation control tower is an operational layer that brings together:
- reconciliation data
- exceptions
- financial exposure
- ownership
- resolution activity
- performance analytics
It does more than list unmatched transactions. It helps finance teams prioritize exceptions by financial and operational risk, manage resolution workflows and spot recurring problems across payment and settlement processes.
Why a Payment Reconciliation Dashboard Is No Longer Just a Reporting Tool
Traditional reconciliation reporting was built to answer one question: did the records match?
That question still matters, but modern payment environments have made reconciliation far more complex. A single payment can create records across several systems:
Customer transaction → Payment gateway → Payment processor → Settlement file → Bank → ERP
Each system may describe the transaction differently. It might use a different transaction ID, timestamp, currency, fee, settlement date, payment status or reference number. Refunds and chargebacks add more events, and partial settlements create even more discrepancies.
As volumes grow, finance teams aren’t just handling more transactions. They’re handling more points where things can break.
That’s why a dashboard that only counts exceptions can create a false sense of control. Compare these two queues:
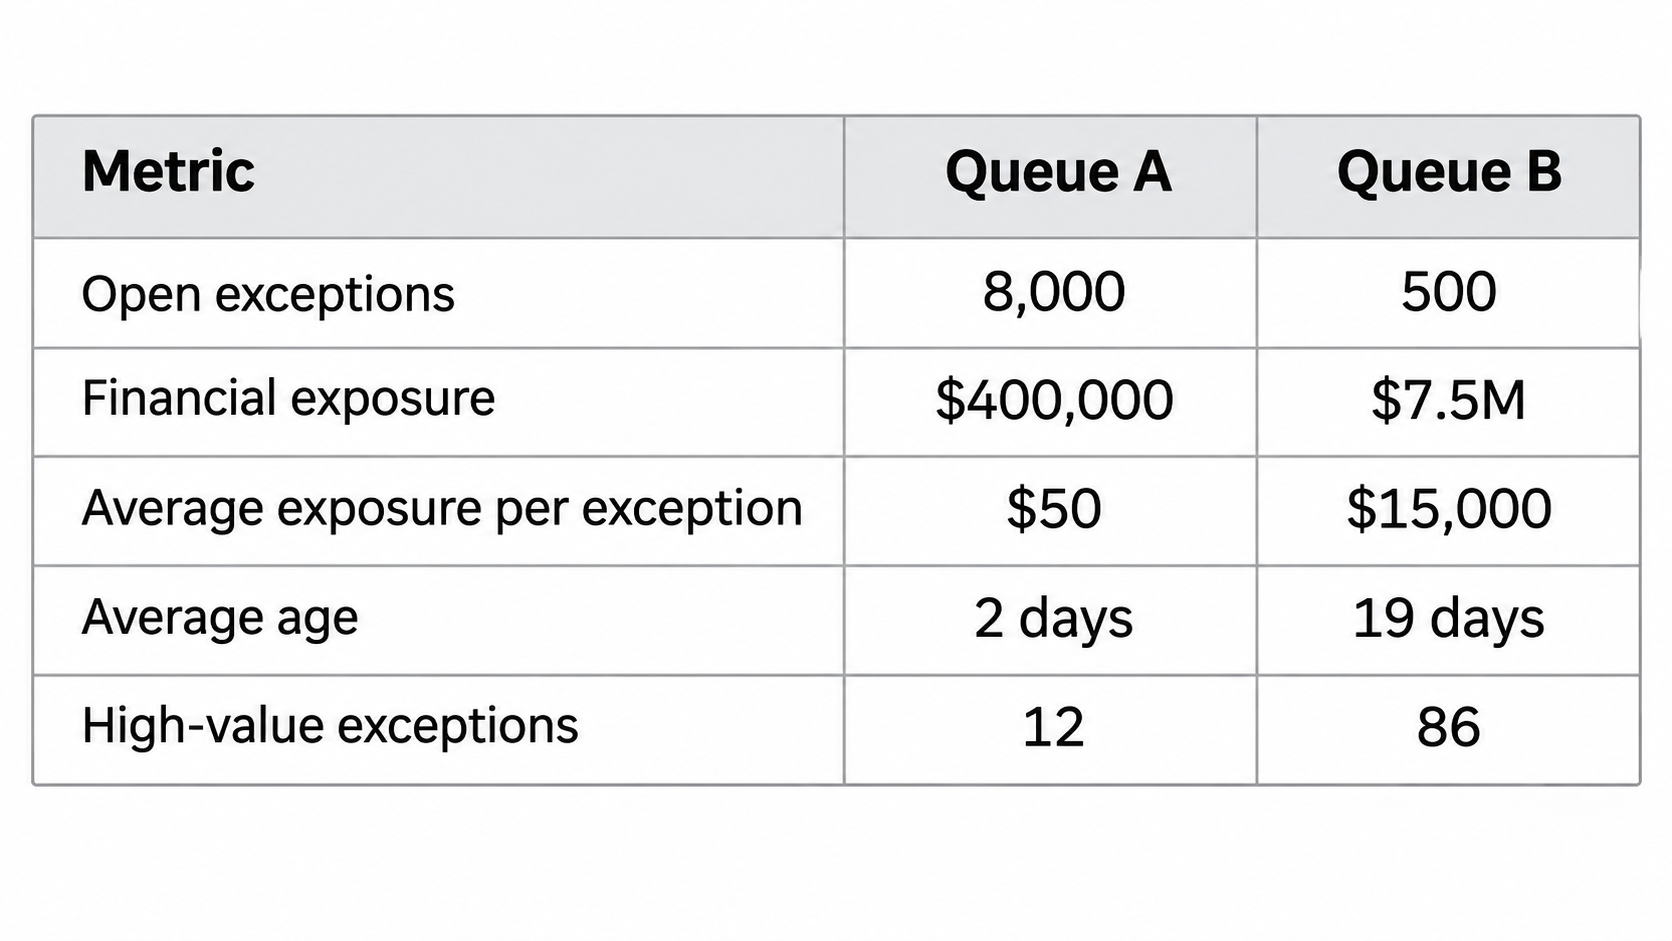
If you only look at volume, Queue A looks worse. From a financial control view, Queue B is far more worrying. It carries 19 times the exposure with 16 times fewer exceptions, and its items have been open nearly 10 times longer.
The difference is context, and a good payment reconciliation dashboard gives your team that context.
The Three Questions Every Reconciliation Team Needs to Answer
A mature reconciliation process answers three questions all the time.
1. What Went Wrong?
This is the exception layer. Your team needs to know whether an item is:
- unmatched or partially matched
- duplicated
- missing from a source
- incorrectly settled
- a fee variance
- a refund or chargeback discrepancy
- a timing difference
- a data-quality issue
Classification matters because each type needs a different action.
2. How Much Does It Matter?
This is the financial exposure layer. An exception should be judged by its value, not just its count.
A queue of 2,000 exceptions at $100 each holds $200,000. A queue of 50 exceptions at $100,000 each holds $5 million. The second queue has 40 times fewer items and 25 times more risk.
That’s why value-weighted exception analysis is often more useful than raw exception volume.
3. How Quickly Are We Resolving It?
This is the performance layer. A team with a big exception queue can still be in good shape if it resolves items quickly and the backlog is shrinking. A small queue can be a real control problem if high-value exceptions are aging with no clear owner.
To see this, you need metrics like:
- exception aging
- average resolution time
- resolution rate
- open versus closed exceptions
- exception inflow versus resolution rate
- high-value exception aging
- resolution by team or owner
- recurring exception categories
The real value comes when all three layers are connected.
From Exception Volume to Exception Risk
Exception management gets hard when every exception is treated the same.
Say your payment operations team receives 10,000 reconciliation exceptions in a monthly cycle. The natural instinct is to drive that number to zero. But zero isn’t always the most useful target. The better question is: which exceptions carry the most financial or operational risk?
A payment reconciliation analytics layer can segment exceptions by:
Value: how much money is involved?
Age: how long has it been open?
Frequency: is it a one-off or a recurring pattern?
Source: does it come from a specific processor, bank, payment method or internal system?
Root cause: is it timing, data quality, configuration, settlement or another process failure?
Business impact: could it affect cash visibility, revenue recognition, customer balances or the financial close?
That creates a much more useful hierarchy. Instead of seeing “10,000 exceptions need attention,” your team can identify that 86 high-value settlement exceptions represent $7.5 million in exposure, 31 have been open for more than 15 days, and 54 originated from the same processor.
That’s actionable intelligence.
Connecting Exceptions to Financial Exposure
Financial exposure is one of the most important things missing from many reconciliation dashboards. The exception count tells you how much work there is. Exception value tells you what’s at stake.
This matters most during the financial close. Say your team has 4,500 unresolved payment exceptions at month-end. That sounds like a lot. But what if:
- 4,000 are low-value timing differences
- 400 are routine fee discrepancies
- 80 are refund mismatches
- 20 are settlement discrepancies worth $4.2M
Those 20 exceptions are less than 0.5% of the queue, yet they average $210,000 each. They may deserve more urgent attention than the other 4,480 combined.
That’s why payment reconciliation analytics should help your team move from volume-based reporting to risk-based prioritization. Your dashboard should show exception value alongside:
- exception type and age
- account, processor and payment channel
- settlement batch
- owner and status
- root cause
The result is a much clearer picture of where financial risk is concentrated.
Payment Reconciliation Exception Management: From Detection to Resolution
Finding an exception is only the start. The workflow usually looks like this:
Detect → Validate → Prioritize → Assign → Investigate → Resolve → Reconcile
- Detect: find records that fail the matching rules.
- Validate: decide whether it’s a genuine exception or an expected timing or data difference.
- Prioritize: rank it by value, age, severity and business impact.
- Assign: hand it to the right team or owner.
- Investigate: trace the transaction across payment, settlement, banking and accounting records.
- Resolve: fix the underlying issue or make the needed adjustment.
- Reconcile: confirm the records now agree and close the exception.
A payment reconciliation dashboard becomes far more useful when it supports this workflow instead of sitting apart from it. The goal isn’t just to show your team what happened. It’s to help them decide what should happen next. Strongexception management ties every one of these stages back to the dashboard.
What Payment Reconciliation Analytics Should Actually Measure
A strong analytics layer measures much more than match rates. Useful metrics include:
Exception rate: what share of transactions need investigation?
Exception value: what’s the total value tied to unresolved exceptions?
Exception aging: how long have exceptions been open?
Resolution rate: how well is the team reducing the backlog?
Average resolution time: how long does it take to close an exception?
Aging by value: how much exposure sits in each aging bucket, such as 0–7, 8–15, 16–30 and 30+ days?
Root-cause distribution: which underlying problems create the most exceptions?
Processor-level performance: do certain processors, payment methods or channels create more than their share?
Recurring exceptions: do the same problems keep coming back?
Inflow versus resolution: are new exceptions arriving faster than the team can close them?
These metrics are much more powerful together.
For example, an exception rate of 1.8% may look fine on its own. On 1 million monthly transactions, that’s 18,000 exceptions. But if the rate has climbed from 0.7% over six months, that’s roughly 11,000 extra exceptions a month, more than 2.5 times the starting level. If most of the new ones come from one payment processor, the trend needs investigating. Goodpayment reconciliation analytics should surface that pattern automatically.
The Reconciliation Control Tower
This is where the control tower idea earns its place. It gives you one operational view across four connected dimensions:
- Reconciliation status: what matched and what didn’t?
- Financial exposure: how much value is tied to unresolved items?
- Exception management: what needs investigating, and who owns it?
- Performance analytics: is the process improving or getting worse?
So the control tower is more than a visualization layer. It’s a decision layer.
A finance leader should be able to drill from a high-level view down to a single exception without losing the link between the transaction, its value, its root cause and its resolution status. For example:
$12.4M unresolved exposure → 146 high-value exceptions → Processor X → Settlement discrepancies → 27 exceptions older than 30 days → Finance Operations team
That chain tells you far more than a red number labelled “146 exceptions.” It’s the difference between aunified dashboard that moves finance from reactive to strategic and one that just reports.
How Optimus Turns Your Payment Reconciliation Dashboard Into a Control Tower
Optimus is built to connect reconciliation status, exception risk, financial exposure and resolution performance in one place.
One connected data layer: the Recon Agent connects, standardizes and validates data from processors, banks, PSPs, ERPs, billing platforms and internal ledgers. Data comes in through APIs, SFTP or secure file uploads, so your dashboard reflects every source, not just one.
Continuous, N-way matching: configurable business rules and AI-powered matching reconcile records across all sources continuously, not just at month-end.
Exceptions that carry context: Optimus flags unmatched transactions, missing settlements, fee discrepancies and breaks. It filters out data-format noise, so the dashboard shows real financial exceptions.
Built-in exception management: configurable routing and case management workflows assign each exception to an owner and track it through to closure, without exporting to spreadsheets.
Analytics that show exposure and trends: real-time dashboards, scheduled reports and operational KPIs show exception value, aging, root cause and processor-level performance side by side.
Audit-ready by default: every match, exception and resolution keeps a complete audit trail.
According to Optimus, teams using the platform:
- reduce time spent on reconciliations by at least 75%
- improve settlement turnaround by up to 100x
- process 576M+ transactions a day on the platform
What Good Looks Like
A mature reconciliation operation usually shows these traits:
Exceptions are prioritized by risk. Not every unmatched transaction gets the same treatment.
Financial exposure is visible. Exception counts are tied to transaction and settlement value.
Ownership is clear. Every material exception has an accountable owner.
Aging is actively managed. Old exceptions don’t vanish into an ever-growing queue.
Root causes are measurable. The team can spot recurring problems instead of fixing symptoms again and again.
Analytics and workflow are connected. Teams go from spotting an issue to resolving it without jumping between spreadsheets and systems.
Performance is tracked over time. You can see whether exception rates, aging and resolution times are improving.
That’s the difference between reconciliation reporting and reconciliation control.
What Technology Can Automate and What Still Needs Judgment
Automation can remove a large share of the manual work in reconciliation. Technology can handle:
- data ingestion and normalization
- record matching
- duplicate detection
- exception classification
- rule-based prioritization
- exception routing
- status tracking and aging analysis
- reporting and trend analysis
But automation doesn’t replace finance professionals. Some exceptions need judgment. A timing difference may be legitimate. A settlement discrepancy may need a conversation with the processor. A recurring data issue may need a fix in an upstream system.
So the goal isn’t to remove people from reconciliation. It’s to remove unnecessary manual work, so your team spends its time on the exceptions that genuinely need investigation and judgment.
Common Mistakes When Building a Payment Reconciliation Dashboard
Measuring volume without value. Lots of low-value exceptions can distract teams from a few that really matter.
Treating every exception equally. Priority should reflect financial exposure, age and operational impact.
Ignoring exception aging. An exception grows more important the longer it stays open, especially when it affects cash, settlement or the close.
Reporting without ownership. A dashboard can find the problem, but someone still has to own the fix.
Separating analytics from workflow. If teams have to export exceptions to spreadsheets before investigating, the dashboard isn’t solving the operational problem.
Measuring resolution without root cause. Closing exceptions fast is good, but closing the same type over and over doesn’t improve the process.
Optimizing for a clean dashboard instead of better controls. The goal isn’t nice-looking numbers. It’s reconciliation that’s accurate, explainable and controllable.
From Payment Reconciliation Dashboard to Financial Control
The next step for payment reconciliation isn’t just a better dashboard. It’s a better operating model. A reconciliation control tower connects the full chain:
Transaction → Matching → Exception → Financial Exposure → Prioritization → Resolution → Analytics
That connection changes the questions your team can ask:
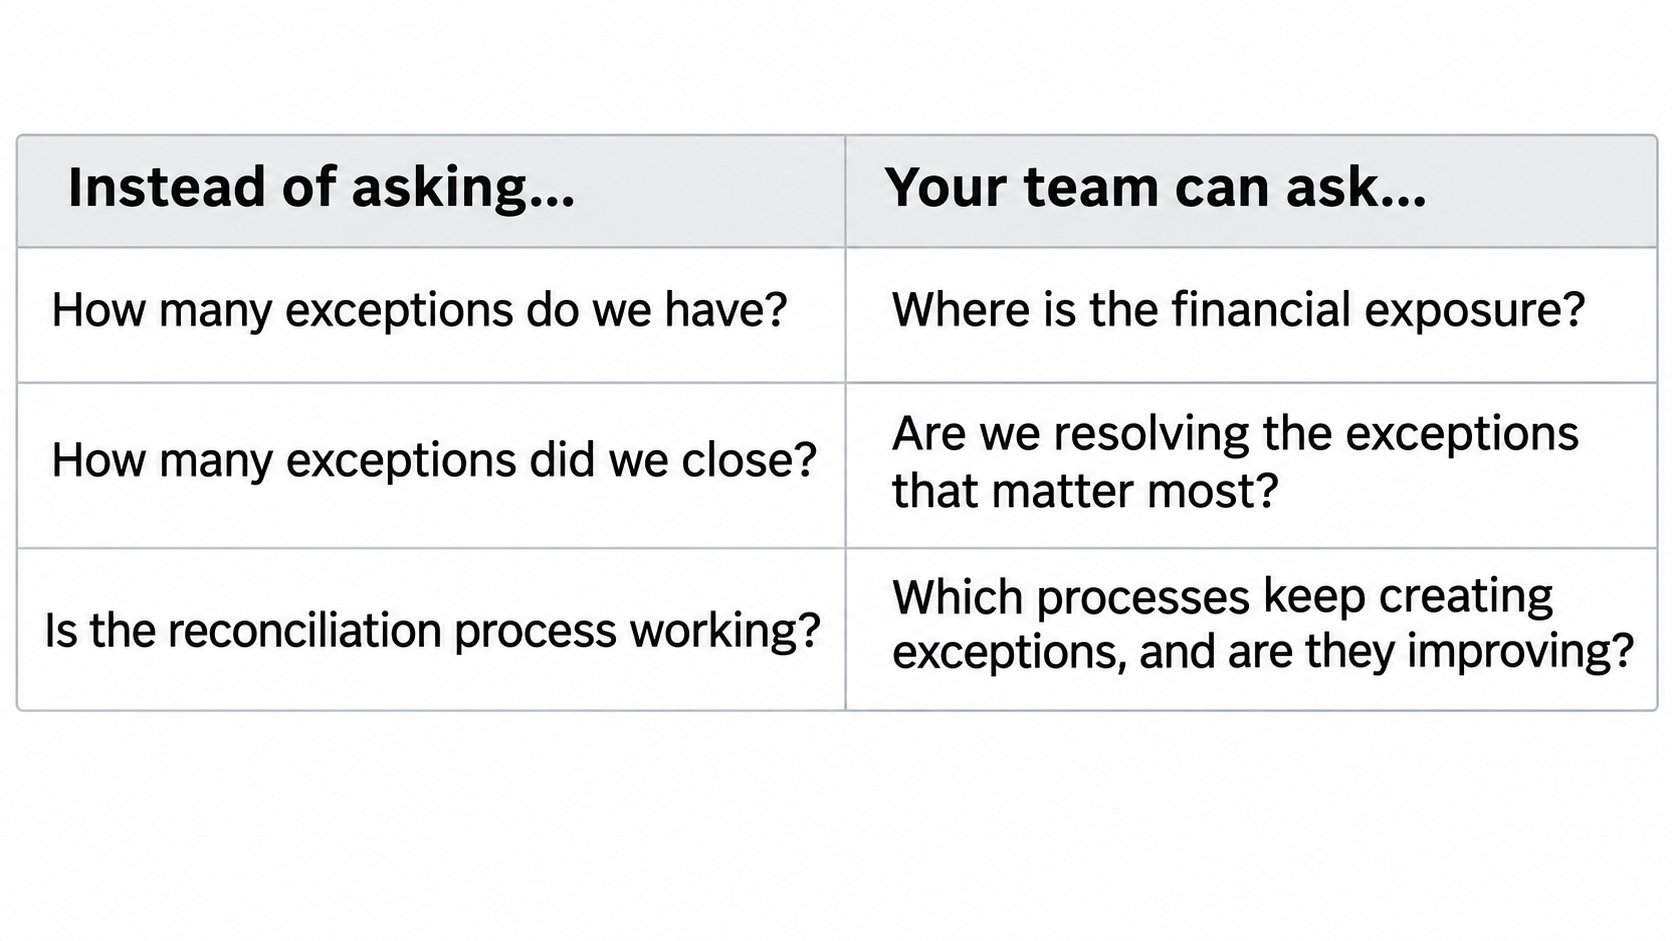
That’s the difference between visibility and control. A payment reconciliation dashboard gives you visibility into the process. A control tower links that visibility to financial risk, operational action and measurable performance.
For finance teams handling large transaction volumes, that difference matters. The goal isn’t just to reconcile more transactions. It’s to know where exceptions exist, what they’re worth, why they happened, who needs to act and whether you’re getting better at preventing them.
That’s when payment reconciliation analytics becomes a financial control capability, not just another reporting exercise. Book a demo and see how a connected reconciliation control tower works for your team.
FAQs
1. What is a payment reconciliation dashboard?
Ans. A payment reconciliation dashboard is a central view that shows how many transactions matched across processors, banks and ERPs, which exceptions are open, their financial value and age, who owns them and how quickly they are being resolved.
2. What is the difference between a reconciliation dashboard and a reconciliation control tower?
Ans. A reconciliation dashboard shows reconciliation status and exception counts. A reconciliation control tower connects that status to financial exposure, ownership, resolution workflows and performance analytics, so finance teams can decide what to act on first, not just see what happened.
3. What should payment reconciliation analytics measure?
Ans. Payment reconciliation analytics should measure exception rate, exception value, exception aging, resolution rate, average resolution time, aging by value, root-cause distribution, processor-level performance, recurring exceptions and exception inflow versus resolution.
4. How does payment reconciliation exception management work?
Ans. Payment reconciliation exception management follows a workflow of detect, validate, prioritize, assign, investigate, resolve and reconcile. Each exception is ranked by value, age and business impact, routed to an owner and tracked until the records agree and the exception is closed.
5. How does Optimus help build a reconciliation control tower?
Ans. Optimus connects processor, bank, PSP and ERP data, matches transactions continuously using configurable rules and AI, routes exceptions through case management workflows and shows exception value, aging and root cause in real-time dashboards. According to Optimus, teams reduce reconciliation time by at least 75%.


